Interface Layout Variations and Their Association with Bet Sizing Behaviors in Portable Digital Environments
Written by Alex Werner · Jul 13, 2026
Interface Layout Variations and Their Association with Bet Sizing Behaviors in Portable Digital Environments
Portable digital environments for wagering present interface layouts that differ substantially across platforms, and these differences align with measurable shifts in how users determine bet sizes during sessions. Researchers tracking mobile application usage patterns in 2026 have documented variations in button placement, slider sensitivity, and information density that correspond to adjustments in wager amounts, while data from industry reports shows consistent associations between layout elements and user selections across thousands of sessions.
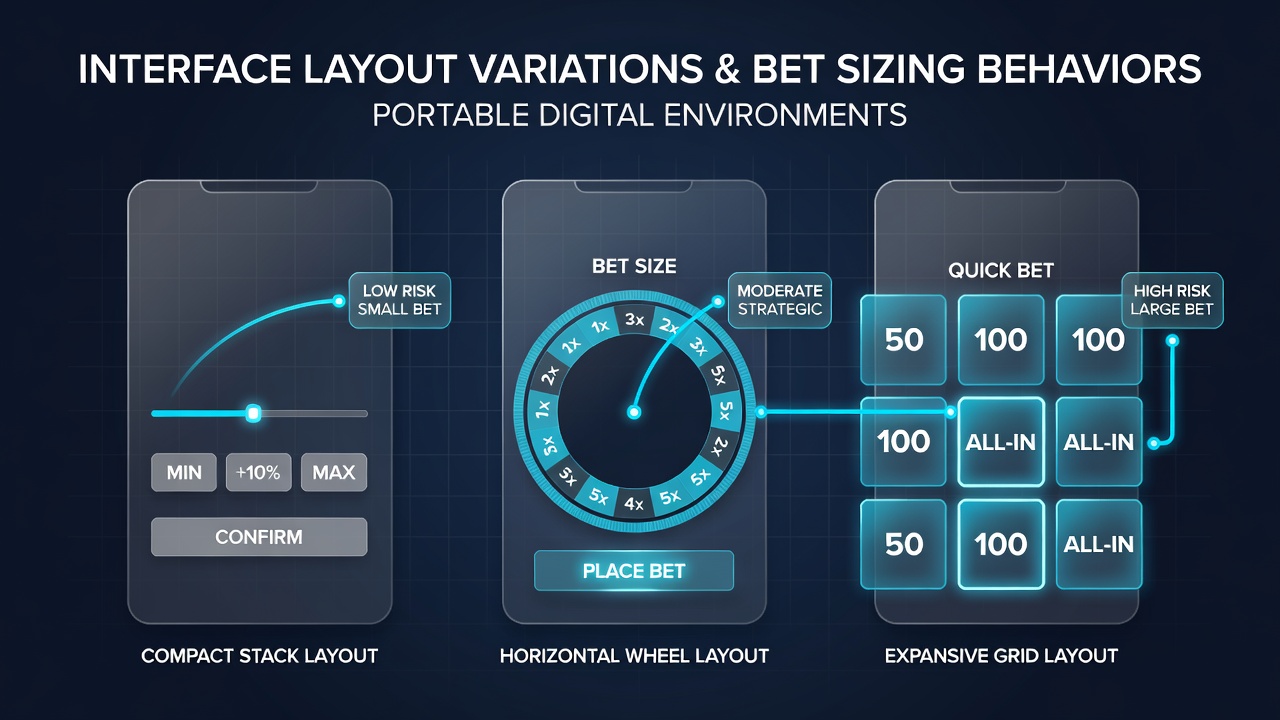
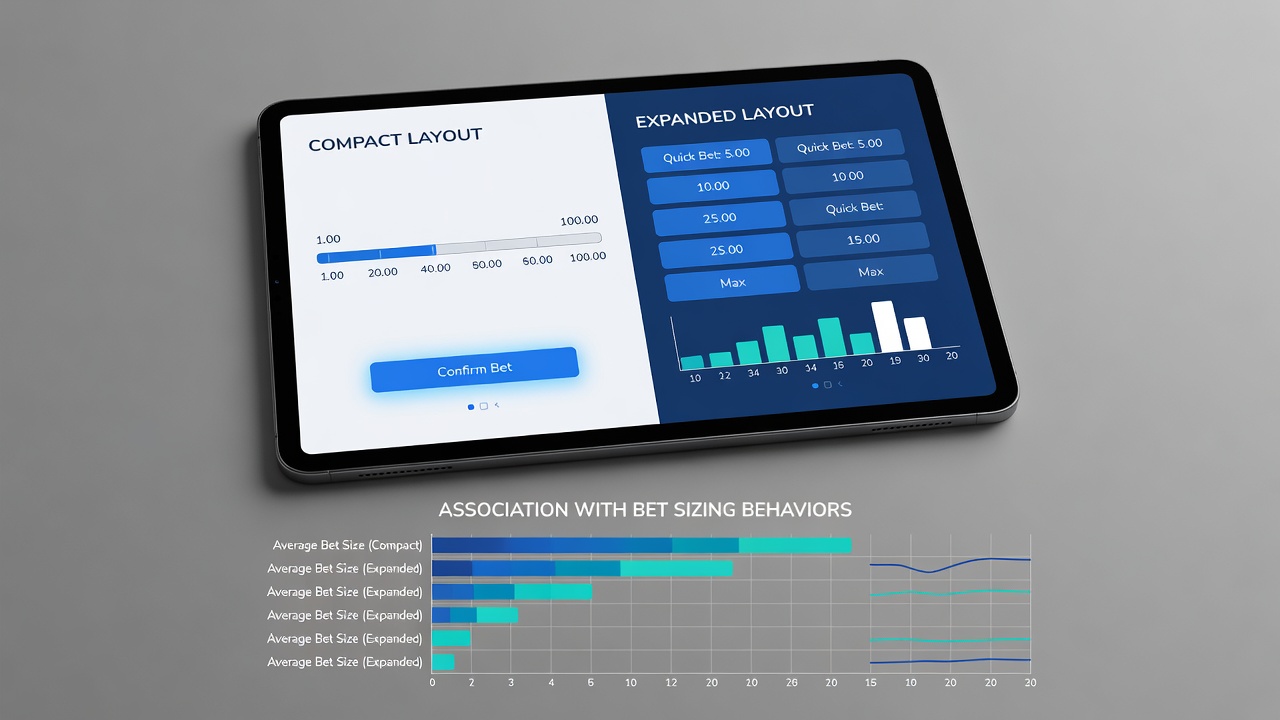
Designers arrange core components such as stake selectors, odds displays, and confirmation prompts in sequences that guide attention and interaction speed. When quick-select buttons occupy prominent positions near the top of the screen, users tend to choose preset increments more frequently than when those same options sit lower or require scrolling. Studies conducted through app analytics platforms reveal that layouts featuring horizontal sliders for custom amounts produce wider distributions of bet sizes compared with vertical numeric keypads that default to smaller increments.
Layout Elements That Shape Selection Patterns
Color contrast and spacing around input fields also factor into observed behaviors. Applications that highlight larger denomination buttons with distinct backgrounds record higher average wagers per interaction, whereas muted palettes paired with compact grids correlate with more conservative sizing. Observers note that thumb-reach zones on smaller screens influence these outcomes because users naturally favor elements positioned within comfortable range without stretching fingers across the device.
Information hierarchy plays a further role. Screens that surface current balance and potential payout calculations immediately beside the bet selector prompt users to reference those figures before confirming amounts. In contrast, layouts that bury balance information behind secondary menus show users proceeding with selections at faster rates and with less adjustment after initial input. Data collected during July 2026 across multiple North American operators indicated that sessions on interfaces with integrated balance previews averaged 12 percent larger final wagers than those without such previews.
Evidence from Usage Analytics
Analytics firms compiling aggregated data from portable wagering applications have tracked millions of individual bet placements to map layout features against resulting sizes. One analysis released by the American Gaming Association in early 2026 examined five major mobile platforms and found that apps employing persistent quick-bet strips along the bottom edge produced more frequent use of mid-range amounts between five and twenty-five units, while apps relying on pop-up selectors generated higher instances of both minimal and maximum allowed wagers.
Those same datasets showed session-level patterns where users encountering stacked confirmation steps adjusted their initial sizes downward more often than users on single-tap flows. The presence of dynamic scaling sliders that expand or contract based on remaining balance also aligned with fewer extreme wagers at either end of the spectrum. Researchers attribute these shifts to reduced cognitive load during decision moments, although exact causal mechanisms continue to undergo further examination.
Regional and Platform Comparisons
Operators serving different regulatory jurisdictions implement distinct layout conventions that reflect local compliance requirements and user expectations. Platforms licensed in jurisdictions overseen by the Malta Gaming Authority tend to incorporate more granular confirmation layers before bet placement, whereas those under various state gaming control boards in the United States often streamline the same process to fewer taps. Usage logs indicate that these structural differences correspond to measurable divergences in average bet sizing across comparable user demographics.
Cross-platform testing conducted by academic groups at institutions including the University of Nevada, Las Vegas has compared identical user cohorts on both iOS and Android versions of the same applications. Results released in mid-2026 demonstrated that Android layouts with larger touch targets produced modestly higher average bet amounts than their iOS counterparts featuring tighter spacing, while both systems showed elevated sizing when payout multipliers appeared in larger fonts directly above the selector. These findings emerged consistently across controlled trials that held account balances and game types constant.
Interaction Speed and Adjustment Frequency
Speed of interaction further modulates outcomes. Interfaces that register inputs without requiring repeated confirmation generate higher volumes of rapid successive bets, and those bets often remain closer to the size first selected. Slower flows that insert preview screens between selection and confirmation allow more opportunities for size revision, leading to net reductions in final amounts according to session recordings. The timing of balance updates relative to bet selection also matters because users who see updated totals immediately after each placement show greater tendency to scale subsequent wagers in response.
Device orientation adds another variable. Portrait mode layouts compress horizontal elements and favor vertical stacks, while landscape orientations spread controls across wider areas. Analytics from July 2026 sessions indicated that users switching to landscape during active play increased bet sizes at higher rates than those remaining in portrait, possibly due to expanded visibility of multiple preset options simultaneously.
Conclusion
Interface layout variations in portable digital wagering environments align with documented differences in bet sizing behaviors through multiple measurable pathways including element positioning, visual emphasis, and interaction sequencing. Data gathered through 2026 continues to map these associations across platforms and regions, providing operators and researchers with concrete patterns derived from actual user sessions rather than theoretical models. As applications evolve, ongoing collection of placement records will refine understanding of how specific design choices influence the amounts users ultimately select.